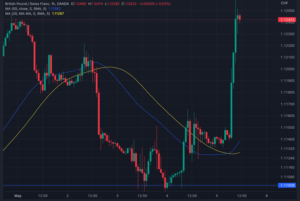
Moving Averages (MA) are one of the most widely used technical analysis indicators by traders. It is a simple indicator that can help identify trends, support and resistance levels, and potential trading opportunities. In this blog, we will discuss how to trade with Moving Averages.
What are Moving Averages?
There are two main types of Moving Averages: Simple Moving Average (SMA) and Exponential Moving Average (EMA).

Simple Moving Average (SMA)
The SMA calculates the average price over a specific period by adding up the closing prices of the asset and dividing it by the number of periods in the calculation. For example, a 20-day SMA will take the sum of the last 20 closing prices and divide it by 20.
Exponential Moving Average (EMA)
The EMA is a type of Moving Average that gives more weight to recent prices, making it more responsive to current market conditions. The EMA is calculated using a complex formula with a smoothing constant that takes into account the previous period’s EMA value and the current price. I do want to stress that knowing how these are calculated is beyond the scope of the intentions of the blog and you do not need to understand the calculations to trade MA’s or EMA’s but I think it’s relevant to include anyway for those intellectually curious.
Trading with Moving Averages
Moving Averages can be used in a variety of ways to help traders identify potential trading opportunities. There are 3 common strategies used by traders. Trend following, Crossover’s and Support & Resistance.
Trend following
One of the most popular ways to use Moving Averages is to identify trends. A trend is when the price is consistently moving in one direction over a period of time. To identify a trend, traders will look for the Moving Average to be sloping up or down.
For example, if the price is above the Moving Average, and the Moving Average is sloping upwards, this could indicate an uptrend. Traders may look for buying opportunities when the price dips down towards the Moving Average and look for selling opportunities when the price moves away from the Moving Average.
Moving Average crossover
Another popular strategy is to look for Moving Average crossovers. This is when two Moving Averages with different time periods cross over each other. For example, a trader may look for the 50-day SMA to cross above the 200-day SMA, which is known as a “golden cross.” This could indicate a bullish signal and a potential buying opportunity.
On the other hand, if the 50-day SMA crosses below the 200-day SMA, which is known as a “death cross,” this could indicate a bearish signal and a potential selling opportunity.
Support and resistance
Moving Averages can also be used to identify support and resistance levels. When the price approaches the Moving Average, it can act as a support or resistance level. For example, if the price is above the Moving Average, the Moving Average may act as a support level. Conversely, if the price is below the Moving Average, it may act as a resistance level.
Conclusion
Moving Averages are a simple yet effective technical analysis tool that can help traders identify potential trading opportunities. Traders can use Moving Averages to identify trends, Moving Average crossovers, and support and resistance levels. However, like all technical analysis indicators, Moving Averages are not fool proof and should be used in conjunction with a strong fundamental analysis and risk management approach.
Learn with the blokes


